Life in the Slow Lane: Cities with the Most Traffic

How crowded are the roads in your city?
It’s a story that happens in cities across the country. Drivers everywhere wake up and prepare for a crowded morning commute. Whether it’s crowded intersections, bumper-to-bumper traffic, or the occasional rear ending that closes a lane on the freeway, a drive that could take 10 minutes ends up taking 20 or more simply due to the amount of cars on the road. The extra time spent commuting certainly adds up. If you work five days a week, 50 weeks a year, commuting twice a day takes 5,000 more minutes than it should, or roughly three and a half days out of your year. And that’s with just 10 more minutes tacked on. For many people, the amount of extra time spent commuting exceeds that, no matter whether they take a bus, ride the subway, or drive to work.
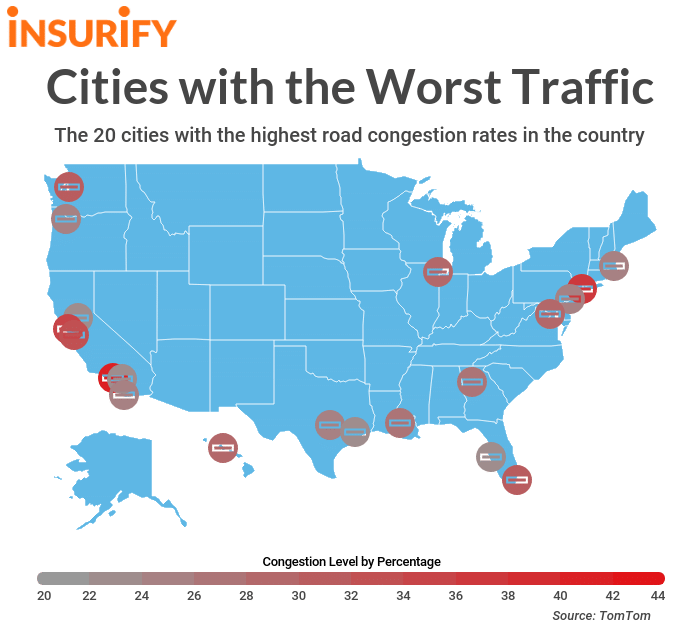
But while heavy traffic is certainly a feature in cities in all corners of the United States, it’s an issue that has become especially bad in specific communities. Curious about which metropolitan areas can truly claim to have the worst traffic in the country, the data scientists at Insurify decided to do some research to determine the 20 cities across the U.S. that suffer from the most road congestion.
Insights
- National averages. On average, 22.21 percent of all drivers have at least one prior driving incident, while 12.43 percent of motorists have a prior car accident specifically. The average commuting time, according to the United States Census Bureau, is 26.9 minutes.
- Clogged along the coasts. In the U.S., most urban centers are concentrated along either the East or the West coast, so it makes sense that the areas with the most traffic would be coastally located. The data backs that assumption up, as 15 of the 20 metropolitan areas that suffer from the greatest congestion are located along either the Atlantic or Pacific Oceans. California is especially bad in that regard, with an astonishing six of the 20 entries on the list.
- More congestion, more accidents? It also may be reasonable to assume that cities with greater congestion—and thus more cars on the road—might be more accident-prone. However, the data actually contradicts this hypothesis. In the 20 cities with the most congestion, there is actually a small, but not insignificant, negative correlation between the congestion level and the percentage of drivers with a prior accident. One possible reason for this? In a city with very congested roads, drivers are likely forced to slow down, and are unable to drive as recklessly as they would in normal traffic levels.
Methodology
To determine which cities in the United States suffered from the most congestion, the research team at Insurify, a website for auto insurance quotes comparison, compiled data on commuting times and traffic congestion. Numbers on the congestion level for the top 20 cities were compiled by TomTom, a consumer electronics company that notably focuses on navigation technology. The congestion level, according to TomTom, is calculated using the measured amount of extra travel time experienced by drivers yearly. Data on average commute time was taken from 2017 data in American Community Survey 5-Year Estimates, which is compiled by the American Census Bureau. Lastly, researchers pulled information on the percentage of drivers in each city with a prior accident as well as the proportion of drivers with a prior incident was found through Insurify’s database of over 1.6 million car insurance applications. To apply for insurance quotes, applicants input personal information and driving history, including whether or not they have a prior driving violation or prior accident on their record.

20. Tampa Bay, Florida
- Congestion level: 23%
- Average commute time: 31.3 minutes
- Percentage of drivers with a prior driving incident: 20.04%
- Percentage of drivers with a prior accident: 13.37%
19. Riverside, California
- Congestion level: 23%
- Average commute time: 28.8 minutes
- Percentage of drivers with a prior driving incident: 23.37%
- Percentage of drivers with a prior accident: 12.05%
18. Houston, Texas
- Congestion level: 23%
- Average commute time: 31.7 minutes
- Percentage of drivers with a prior driving incident: 16.58%
- Percentage of drivers with a prior accident: 10.07%
17. Sacramento, California
- Congestion level: 23%
- Average commute time: 29.2 minutes
- Percentage of drivers with a prior driving incident: 24.2%
- Percentage of drivers with a prior accident: 13.13%
16. Philadelphia, Pennsylvania
- Congestion level: 24%
- Average commute time: 35.7 minutes
- Percentage of drivers with a prior driving incident: 19.35%
- Percentage of drivers with a prior accident: 11.61%
15. Portland, Oregon
- Congestion level: 24%
- Average commute time: 31.6 minutes
- Percentage of drivers with a prior driving incident: 27.88%
- Percentage of drivers with a prior accident: 15.35%
14. Austin, Texas
- Congestion level: 25%
- Average commute time: 29.1 minutes
- Percentage of drivers with a prior driving incident: 24.5%
- Percentage of drivers with a prior accident: 15.5%
13. Boston, Massachusetts
- Congestion level: 25%
- Average commute time: 41.7 minutes
- Percentage of drivers with a prior driving incident: 23.95%
- Percentage of drivers with a prior accident: 14.6%
12. San Diego, California
- Congestion level: 25%
- Average commute time: 28.4 minutes
- Percentage of drivers with a prior driving incident: 23.45%
- Percentage of drivers with a prior accident: 14.24%
11. Baton Rouge, Louisiana
- Congestion level: 26%
- Average commute time: 27.6 minutes
- Percentage of drivers with a prior driving incident: 19.41%
- Percentage of drivers with a prior accident: 13.64%
10. Atlanta, Georgia
- Congestion level: 26%
- Average commute time: 37.7 minutes
- Percentage of drivers with a prior driving incident: 20.83
- Percentage of drivers with a prior accident: 12.06%
9. Honolulu, Hawaii
- Congestion level: 28%
- Average commute time:
- Percentage of drivers with a prior driving incident: 28.03%
- Percentage of drivers with a prior accident: 14.18%
8. Washington D.C.
- Congestion level: 28%
- Average commute time: 43.2 minutes
- Percentage of drivers with a prior driving incident: 22.96%
- Percentage of drivers with a prior accident: 14.12%
7. Chicago, Illinois
- Congestion level: 28%
- Average commute time: 39.2 minutes
- Percentage of drivers with a prior driving incident: 16.95%
- Percentage of drivers with a prior accident: 9.44%
6. Miami, Florida
- Congestion level: 30%
- Average commute time: 36.4 minutes
- Percentage of drivers with a prior driving incident: 16.45%
- Percentage of drivers with a prior accident: 11.51%
5. Seattle, Washington
- Congestion level: 31%
- Average commute time: 36.9 minutes
- Percentage of drivers with a prior driving incident: 23.8%
- Percentage of drivers with a prior accident: 13.03%
4. San Jose, California
- Congestion level: 32%
- Average commute time: 31.5 minutes
- Percentage of drivers with a prior driving incident: 21.67%
- Percentage of drivers with a prior accident: 13.2%
3. San Francisco, California
- Congestion level: 34%
- Average commute time: 40.6 minutes
- Percentage of drivers with a prior driving incident: 19.7%
- Percentage of drivers with a prior accident: 11.83%
2. New York, New York
- Congestion level: 36%
- Average commute time: 46.5 minutes
- Percentage of drivers with a prior driving incident: 19.12%
- Percentage of drivers with a prior accident: 10.14%
1. Los Angeles, California
- Congestion level: 41%
- Average commute time: 35.4 minutes
- Percentage of drivers with a prior driving incident: 19.09%
- Percentage of drivers with a prior accident: 12.17%
More From KICK AM, Classic Country